In this blog post, we will look into Top 10 productivity tips and tricks in Visual Studio 2019 that can not only help to make the developer’s life a lot easier but also help to increase the productivity time. Below given is the curated list of tips and tricks to be discussed in the post.
Visual Studio 2019 is one of the best developer friendly Integrated Development Environment (IDE). The IDE has tons of features that help to ease the development process. These features can be further customized or new features can be added using Visual Studio Extensions.
Visual Studio 2019 has support for a huge list of programming languages and application frameworks. Applications ranging from the Mobile app, Windows app, Web App, Cloud Services, IoT apps, and many more can be built using this single IDE and the best of all the fully-featured Community Edition can be used without any license fee. [Download here]
Run To Cursor
Run to Cursor is one of the best nifty little features of Visual Studio that comes very handy during debugging of a code block. The developer can quickly execute a block of code and break to a line where the cursor is present.
This can help to avoid step by step code debugging and can quickly help to navigate to the line of code where the developer’s interest lies by executing code in between the start and endpoint. There are three different ways to use Run to Cursor.
- Using the context menu: Go to the line where you want to stop the debugger, and right-click to open the context menu and select “Run to Cursor” menu item.
- Using Ctrl + F10 shortcut: Go to the line where you want to stop the debugger and press Ctrl + F10.
- Using the “Run Execution to here” button: Hover the mouse on the beginning of the line where you want to stop the debugger, this will display the “Run Execution to here” button, click on it, and done.
Track Active file in Solution Explorer
Solution Explorer displays a hierarchical list of all the files in a Visual Studio solution. The user can open the respective file in the code editor by double-clicking on it. One of the problems with Solution Explorer is that it does not reflect or track the current file being edited. If the user wants to locate the file in the Solution Explorer he needs to scroll and find it manually and this becomes really cumbersome when the Solution contains a huge number of projects and files in it.
Visual Studio provides a configurable “Track Active Item in Solution Explorer” flag to enable the Solution Explorer to track (highlights) the file being edited. To enable this feature go to the Tools > Options > Projects and Solutions > General and check the “Track Active Item in Solution Explorer” option and click OK. As we can see in the below given GIF
Enhanced Search (Quick Launch)
Enhanced Search previously known as the Quick Launch can be used to search files, folders, class names, method names, and search across the IDE settings, options, menus, actions, project templates as well as suggestions from the web.
The Enhanced Search also remembers the search queries for any future use. The search can be enabled using the shortcut CTRL+Q keys. Like for example if you want to changes the theme of the IDE, just press CTRL+Q and type theme, it will display the IDE option link to change the theme.
Navigating using “Go to All”
This is another great little feature that I believe every user must be aware of. The feature helps the user to quickly navigate throughout the code and also find a specified search term. The command can help to go to a specific line, a type, symbol, file, a member within a type or unified interface. The user can also apply various filters on the search criteria.
The command can be invoked in two ways first is using the shortcut Ctrl+T or Ctrl+, or using the menu Edit > Go To> Go to All. This will display a small window at the top-right corner of the code editor from where the user can perform his search and navigate operation. This feature in itself contains various functionality and all cannot be discussed in this quick description. The complete details about the feature can be found in this blog post.
Collapse to Definition
There may be a situation where the user wants to quickly see the definition of all the members inside a class or want to collapse the code definition of the class members, then this can be done using the Ctrl+M, O shortcut.
Vertical Selection
If the user wants to select multiple lines vertically, then this can be done by placing the cursor at the starting point of the code and holding the Shift+Alt key, and moving the mouse or the arrow keys to the endpoint.
Display Output Window When Building Project
The Visual Studio Output Window displays status messages of features like MSBuild, Intellisense, Package Managers, etc and can be easily configured to display output of an external batch file (.bat) or a COM file. The users also can display application runtime diagnostic messages to the output window using Debug or Trace class from .NET API. The output window can be open in two ways, first is from the menu bar, select View > Output, or using the shortcut key Ctrl+Alt+O.
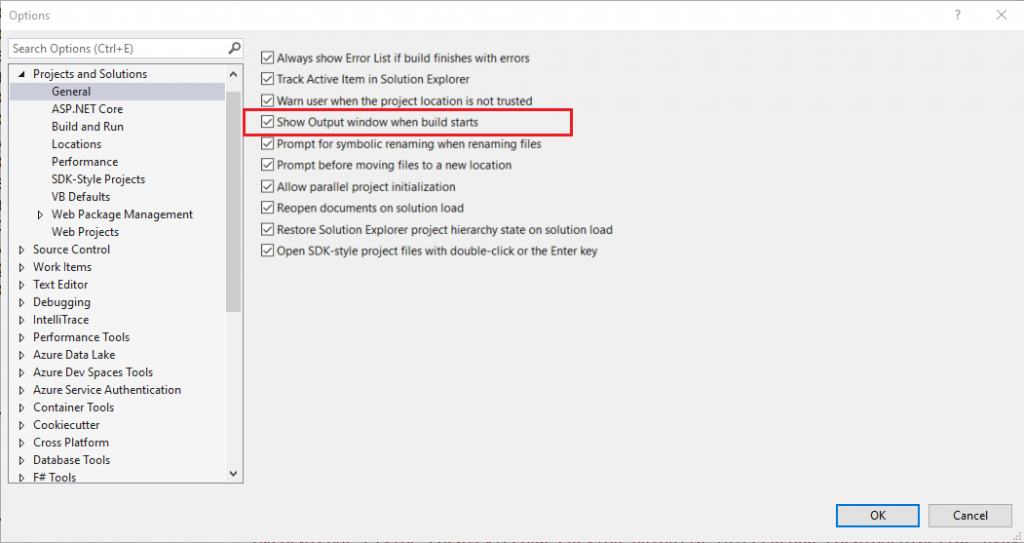
In order to automatically display the Output window during project build, the user can enable by going to Tools > Options > Projects and Solutions and selecting the “Show output window when build starts” option. A detailed discussion about the Output window can be found in this post.

Code Cleanup and Health Indicator
This is a new feature of Visual Studio 2019 and is composed of two functionality, first, one is the code health indicator and display the code error and warnings and shortcuts to navigate between them.
The second one is the code cleanup and applies a fix for code warnings and suggestions with the click of a button. The cleanup formats the code and also applies code fixes that are configured in the current settings and .editorconfig files. The user can create multiple profiles to suit his project needs. Use the shortcut Ctrl+K, Ctrl+E to perform the cleanup.

Increase Solution Load Time
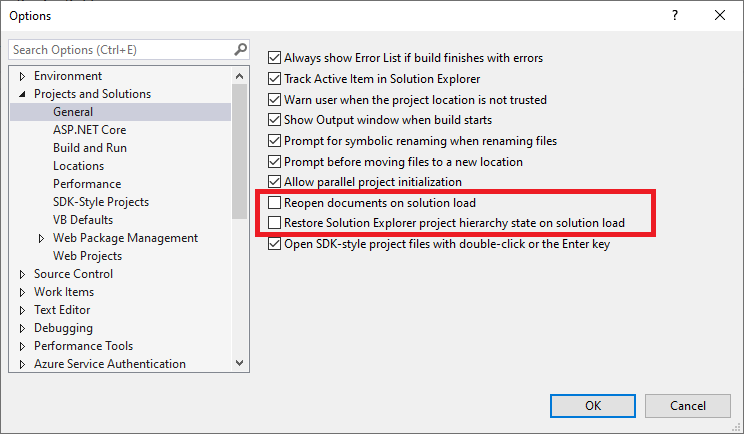
The loading time of a solution can be increased by disabling these two configurations, that is, “Reopen documents on solution load” and “Restore Solution Explorer project hierarchy state on solution load” from the Tools > Options > Projects and Solutions menu.

Reattach to Process
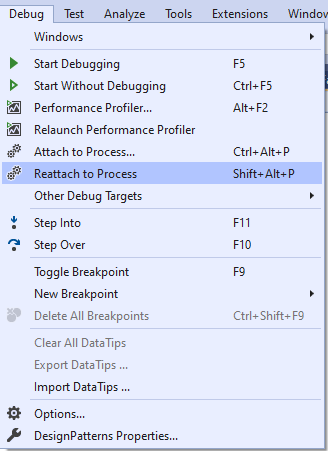
This is one the great little feature of Visual Studio 2019 and I believe it will be every developer’s favorite one, it lets you reattach to the processes from the previously attached processes debugging sessions. And the best part of it is, it can be done using a Shift + Alt + P shortcut, thus saving you from going to the menu, selecting attach to process, and then finding the process to attach to.

Visual Studio 2019 is full of small great little features that help the user to perform his task in an easy and efficient way and the post discusses only a few of them.
I hope this post on productivity tips and tricks in Visual Studio 2019 is helpful to you, thanks for visiting, Cheers!!!
[Further Readings: CRUD Operations in WPF using EntityFrameworkCore and SQLite | How to implement Dependency Injection in WPF | How to use External Tool in Visual Studio 2019 | Top Features of Visual Studio 2019 Community Edition | Basic CRUD operations in Blazor using SQLite as the database | How to consume REST API in Blazor Application | Blazor Lifecycle Methods | A Simple way to Call Javascript in Blazor Application | Creational Design Patterns | Builder Design Pattern in C# | Prototype Design Pattern in C# | Top 5 Blazor Component Libraries | Abstract Factory Design Pattern in C# | Factory Method Pattern in C# | Singleton Design Pattern in C# | Introduction to Design Patterns | Microsoft C# Version History | Microsoft .NET Core Versions History ]